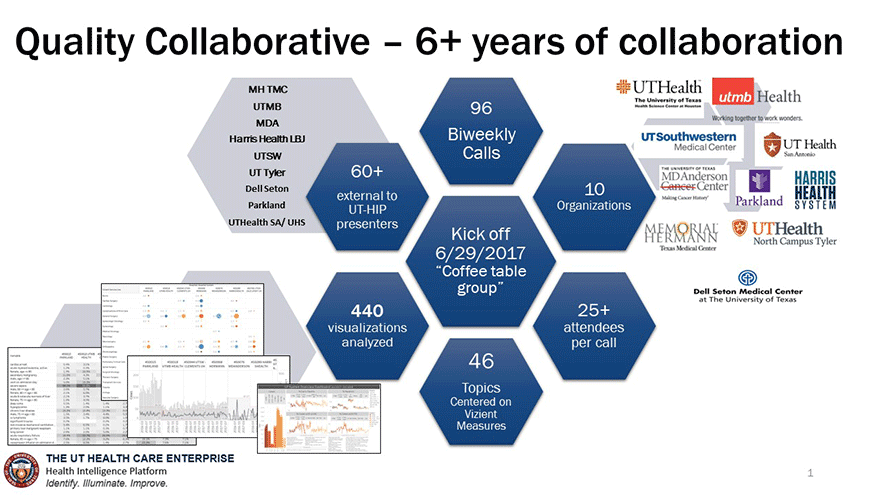
UT-HIP creates custom dashboards, rank report cards, and clinical quality reports that allow users to compare their performance to national peers and their fellow UT institutions.
The fundamental strategy is to illuminate, identify and improve.
ILLUMINATE: Highlight the details that have led to variability of care in order to identify opportunities for intervention.
IDENTIFY: Ascertain opportunities across the institutions.
IMPROVE: Support value improvement initiatives for selected conditions.
Overview
The University of Texas Health Intelligence Platform (UT-HIP) is a program designed to integrate and analyze health data from The University of Texas System’s eight health institutions and two medical schools.
Two of the key tools used to accomplish this goal are:
Vizient Clinical Database (CDB) An analytics platform that provides monthly tracking of health-related measures like mortality, length of stay, readmission rates, and hospital-acquired conditions, as well as cost and efficiency measures.
Society of Thoracic Surgeons National Database (STS) The STS National Database is the gold standard for CT surgery clinical outcomes registries, with nationally recognized quality performance measures for adult cardiac, general thoracic, congenital heart surgery, and mechanical circulatory support.
Collaboratives
There are two UT-HIP quality focused collaboratives:
The UT-HIP Quality Collaborative is the systemwide group of Chief Quality Officers and other quality leaders from the eight health and medical institutions within the UT System. This collaborative meets every two weeks.
The UT-HIP Cardiac Surgeons Quality Collaborative (UTCSQC) is a systemwide group of the Chairs of cardiac surgery. This collaborative meets quarterly.
Both quality collaboratives take specific measures from the CDB and STS, analyze the data across institutions for opportunities for improvement, hear from the institutions that are doing it best, and then implement new practices when appropriate.
The UT-HIP team supports both of these efforts by analyzing data, developing custom visualizations, continually refining dashboards, and presenting findings to the teams.

